Capital Clean Energy Carriers Corp. Announces Fourth Quarter 2025 Financial Results
Key Quarterly Highlights
- Ordered three latest-technology LNG carriers with deliveries in 2028 and 2029
- Concluded the sale of a 13,696 TEU container vessel, the M/V Buenaventura Express
- Took delivery of our first LCO2/multi-gas carrier, the Active
- Announced dividend of
$0.15 per share for the fourth quarter of 2025
Key Financial Highlights (continuing operations)
| Three-month period ended |
|||
| 2025 | 2024 | Increase/ (Decrease) |
|
| Revenues | 0.7% | ||
| Expenses | 0.7% | ||
| Interest expense and finance cost | (28.4%) | ||
| Net Income | 36.5% | ||
| Average number of vessels1 | 13.0 | 13.0 | 0.0% |
1 Average number of vessels is measured by aggregating the number of days each vessel was part of our fleet during the period and dividing such aggregate number by the number of calendar days in the period.
Management Commentary
Mr.
“During the fourth quarter, we continued to execute on our strategy to build a leading gas transportation platform, delivering resilient earnings and strong cash generation from our modern LNG fleet. We expanded our long-term growth profile by ordering three latest-technology LNG carriers for delivery in 2028 and 2029, further reinforcing our position as the largest
We also advanced our transition away from container shipping, agreeing to the sale of an additional Neo-Panamax container vessel in the fourth quarter, with the proceeds from the sale received in the first quarter of 2026 used to further strengthen our balance sheet. In early January, we took delivery of the Active, our first LCO2/multi-gas carrier, marking an important milestone as we enter emerging energy-transition markets, in parallel with our presence in commercially competitive conventional gas trades. Supported by our contracted cash flows, disciplined capital allocation, and substantial liquidity, we remain focused on funding our orderbook and creating long-term value for our shareholders.”
In
Since
Financial results from discontinued operations include revenues, expenses and cash flows arising from the 14 container vessels we have sold, following the announcement of our strategic shift in
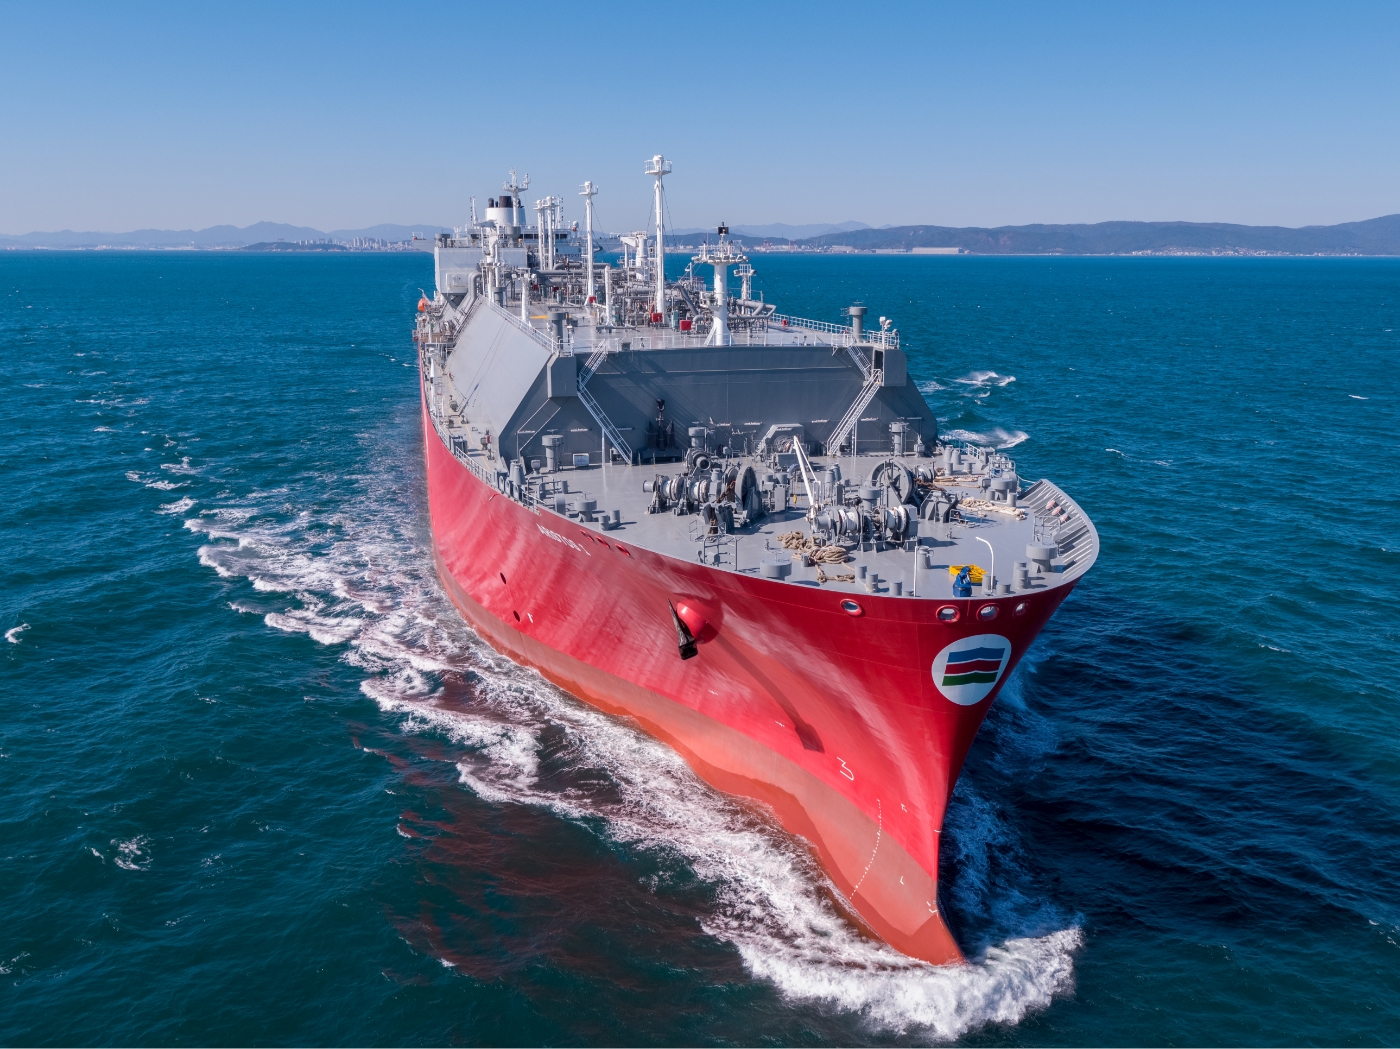
Fleet Update
The first of our LCO2/multi-gas carriers, the Active (28,629 DWT, 22,000 CBM, low-pressure LCO2 carrier,
Container Divestment Update
On
Contracting of three latest-technology LNG/Cs
On
With its latest order for three additional LNG/Cs, the Company reaffirms its strategic position as the largest US-listed LNG shipping company, with 12 LNG/Cs currently in the water and nine LNG/Cs on order (“Newbuild LNG/Cs”).
Under-Construction Fleet Update
The Company’s under-construction fleet includes nine latest generation LNG/Cs (comprising the remaining Newbuild LNG/Cs that have not yet been delivered to the Company) and the Gas Fleet. The following table sets out the Company’s schedule of expected capex payments for its under-construction fleet as of
Capex Schedule of CCEC in USD million, as of
| Q1 26 | Q2 26 | Q3 26 | Q4 26 | Q1 27 | Q2 27 | Q3 27 | Q4 27 | Q1 28 | Q2 28 | Q3 28 | Q4 28 | Q1 29 | Total | |
| Newbuild LNG/Cs | 62.0 | 51.2 | 393.7 | 0.0 | 702.2 | 24.7 | 0.0 | 74.0 | 0.0 | 49.4 | 186.4 | 0.0 | 372.8 | 1,916.4 |
| Gas Fleet | 29.8 | 105.4 | 115.4 | 47.7 | 89.3 | 46.9 | 35.9 | 0.0 | 0.0 | 0.0 | 0.0 | 0.0 | 0.0 | 470.4 |
| Total | 91.8 | 156.6 | 509.1 | 47.7 | 791.5 | 71.6 | 35.9 | 74.0 | 0.0 | 49.4 | 186.4 | 0.0 | 372.8 | 2,386.8 |
The Company has paid by the end of the fourth quarter of 2025,
Overview of Fourth Quarter 2025 Results
Net income for the quarter ended
Total revenue for the quarter ended
Total expenses for the quarter ended
Total expenses for the fourth quarter of 2025 also include vessel depreciation and amortization of
Total other expenses, net for the quarter ended
Company Capitalization
As of
As of
As of
As of
Issuance of €250.0 million unsecured bonds
On
The Bonds will mature in 2033 and will bear a coupon of 3.75%, payable semi-annually.
The proceeds of the Bonds will be used to refinance the outstanding €150.0 million unsecured bond issued in 2021, as well as to partially fund CCEC’s capital expenditures and support the Company’s working capital needs. CCEC estimates the expenses related to the offering to be approximately €7.5 million.
ATM Program
On
Dividend Reinvestment Plan (“DRIP”)
The Company has implemented a Dividend Reinvestment Plan to provide our shareholders with a convenient and economical way to reinvest cash dividends to purchase our common shares. The DRIP is available to our existing shareholders and investors who may become our shareholders in the future outside of the DRIP. In
Quarterly Dividend Distribution
On
LNG Market Update
The fourth quarter of 2025 saw the strongest spot LNG shipping market of the past two years. Spot charter rates for two-stroke vessels averaged approximately
Unexpectedly higher production out of the
Two-stroke vessels fully captured the benefits of the strengthening market, while rates for older, smaller, and less efficient tonnage improved only marginally. This divergence underscores the increasingly limited commercial relevance of older vessels going forward.
Mid- and long-term time charter rates softened slightly during the quarter, with multiple fixtures concluded in the low- to mid-$80,000 per day range, driven primarily by long-term fundamentals. Ordering activity increased materially in the fourth quarter following three comparatively quiet quarters by historical standards. A total of 23 LNG carriers were ordered during the quarter, 17 of which were placed in December alone. For context, only 21 vessels were ordered across the previous three quarters combined. This surge in ordering activity has resulted in upward pressure on newbuilding prices, with the latest contracts each concluded at slightly greater than
As of quarter-end, 283 LNG carriers were on order, with 23 vessels delivered during the fourth quarter of 2025. Of the total orderbook, analysts estimate that only 35 vessels remain without committed employment, six of which are controlled by the Company.
LPG Market Update
CCEC has an additional nine gas carriers on order as part of its Gas Fleet, consisting of three LCO₂ / multi-gas carriers and six dual-fuel medium gas carriers .The deliveries commenced with the handy LCO2/multi-gas carrier Active (22,000 CBM, Hyundai) in
Market conditions across both handy-sized and mid-size gas segments remained positive, with employment reflecting a balanced mix of spot exposure and short-term time charters. The multi-gas carrier (“MGC”) fleet amounts to 138 vessels, of which approximately 68% is secured on time charter coverage, with around 32% of the time charter fleet employed in ammonia trading. The semi-refrigerated handy-sized segment comprises 57 vessels, of which 49 are fixed on short term time charters (less than two years), with approximately 16% of the time charter fleet engaged in ammonia trading during the fourth quarter of 2025.
Earnings were supported by stable rates and strong utilization, particularly in the handy-sized segment, driven by continued butadiene flows to the Far East and ambient Iraqi LPG exports. The MGC segment recorded its strongest fixing quarter in recent years, benefiting from robust US LPG export volumes that tightened VLGC availability. Elevated VLGC rates encouraged charterers to seek alternative tonnage, supporting strong earnings throughout the reporting period.
Looking ahead, supply growth in the semi-refrigerated handy-sized segment remains limited. Looking into 2026, there are only seven vessels scheduled for delivery until year end, representing approximately 12% of the existing fleet. The MGC segment saw two newbuildings delivered during the fourth quarter of 2025, with a further 22 vessels expected over the next 12 months, equating to approximately 16% of the current fleet.
Time charter rates remained firm during the fourth quarter, with semi-refrigerated handy-sized vessels assessed at
Corporate Governance Update
Conference Call and Webcast
Today,
Conference Call Details
Participants should dial into the call 10 minutes before the scheduled time using the following numbers: 877 405 1226 (US Toll-Free Dial In) or +1 201 689 7823 (US and Standard International Dial In). Please quote “Capital Clean Energy” to the operator and/or conference ID 13759104. Click here for participant International Toll-Free access numbers. Alternatively, participants can register for the call using the “Call Me” option for a faster connection to join the conference call. You can enter your phone number and let the system call you right away.
Slides and Audio Webcast
There will also be a live, and then archived, webcast of the conference call and accompanying slides, available through the Company’s website. To listen to the archived audio file, visit our website http://ir.capitalcleanenergycarriers.com/ and click on Webcasts & Presentations under our Investor Relations page. Participants in the live webcast should register on the website approximately 10 minutes prior to the start of the webcast.
About
For more information about the Company, please visit: www.capitalcleanenergycarriers.com
Forward-Looking Statements
The statements in this press release that are not historical facts, including, among other things, statements related to CCEC’s ability to pursue growth opportunities and CCEC’s expectations or objectives regarding future vessel deliveries and charter rate expectations, are forward-looking statements (as such term is defined in Section 21E of the Securities Exchange Act of 1934, as amended). These forward-looking statements involve risks and uncertainties that could cause the stated or forecasted results to be materially different from those anticipated. For a discussion of factors that could materially affect the outcome of forward-looking statements and other risks and uncertainties, see “Risk Factors” in our annual report filed with the
Contact Details:
Investor Relations / Media
EVP Investor Relations
Tel. +44 (770) 368 4996
E-mail: b.gallagher@capitalmaritime.com
Capital
Tel. +1-212-661-7566
E-mail: ccec@capitallink.com
Unaudited Condensed Consolidated Statements of Comprehensive Income
(In thousands of United States Dollars, except for number of shares and earnings per share)
| For the three-month periods ended |
For the years ended |
|||||||
| 2025 | 2024 | 2025 | 2024 | |||||
| Revenues | 98,348 | 97,610 | 392,706 | 339,549 | ||||
| Expenses: | ||||||||
| Voyage expenses | 2,476 | 2,417 | 7,733 | 9,833 | ||||
| Vessel operating expenses | 14,201 | 13,650 | 59,083 | 50,170 | ||||
| Vessel operating expenses - related parties | 2,312 | 2,412 | 9,144 | 8,722 | ||||
| General and administrative expenses | 3,955 | 4,272 | 15,598 | 16,682 | ||||
| Vessel depreciation and amortization | 21,886 | 21,766 | 87,213 | 76,454 | ||||
| Operating income, net | 53,518 | 53,093 | 213,935 | 177,688 | ||||
| Other (expense) / income, net: | ||||||||
| Interest expense and finance cost | (23,907) | (33,409) | (103,128) | (125,760) | ||||
| Other (expense) / income, net | (1,258) | 1,106 | 2,587 | 3,262 | ||||
| Total other expense, net | (25,165) | (32,303) | (100,541) | (122,498) | ||||
| Net income from continuing operations | 28,353 | 20,790 | 113,394 | 55,190 | ||||
| Net income from discontinued operations | 8,165 | 81,466 | 57,365 | 138,444 | ||||
| Net income from operations | 36,518 | 102,256 | 170,759 | 193,634 | ||||
| Net income attributable to |
- | - | - | 743 | ||||
| Deemed dividend to |
- | - | - | 46,184 | ||||
| Net income attributable to unvested shares | - | 391 | - | 808 | ||||
| Net income attributable to common shareholders | 36,518 | 101,865 | 170,759 | 145,899 | ||||
| Net income from continuing operations per: | ||||||||
| Common shares, basic and diluted | 0.48 | 0.35 | 1.92 | 0.15 | ||||
| Weighted average shares outstanding: | ||||||||
| Common shares, basic | 59,302,122 | 58,390,900 | 58,919,848 | 56,094,666 | ||||
| Common shares, diluted | 59,703,282 | 58,390,900 | 59,191,879 | 56,094,666 | ||||
| Net income from discontinued operations per: | ||||||||
| Common shares, basic and diluted | 0.14 | 1.39 | 0.97 | 2.45 | ||||
| Weighted average shares outstanding: | ||||||||
| Common shares, basic | 59,302,122 | 58,390,900 | 58,919,848 | 56,094,666 | ||||
| Common shares, diluted | 59,703,282 | 58,390,900 | 59,191,879 | 56,094,666 | ||||
| Net income from operations per: | ||||||||
| Common shares, basic | 0.62 | 1.74 | 2.90 | 2.60 | ||||
| Common shares, diluted | 0.61 | - | 2.88 | - | ||||
| Weighted average shares outstanding: | ||||||||
| Common shares, basic | 59,302,122 | 58,390,900 | 58,919,848 | 56,094,666 | ||||
| Common shares, diluted | 59,703,282 | 58,390,900 | 59,191,879 | 56,094,666 | ||||
Unaudited Condensed Consolidated Balance Sheets
(In thousands of United States Dollars)
| As of |
As of |
|||
| Assets | ||||
| Current assets | ||||
| Cash and cash equivalents | $ | 273,843 | $ | 312,654 |
| Trade accounts receivable | 8,437 | 3,689 | ||
| Prepayments and other assets | 7,437 | 7,194 | ||
| Due from related party | - | 1,131 | ||
| Inventories | 3,982 | 4,427 | ||
| Claims | 1,044 | 865 | ||
| Current assets of discontinued operations | 124,238 | 75,583 | ||
| Total current assets | 418,981 | 405,543 | ||
| Fixed assets | ||||
| Advances for vessels under construction – related party | 54,000 | 54,000 | ||
| Vessels, net and vessels under construction | 3,516,778 | 3,289,660 | ||
| Total fixed assets | 3,570,778 | 3,343,660 | ||
| Other non-current assets | ||||
| Above market acquired charters | 66,597 | 101,574 | ||
| Deferred charges, net | 3,483 | 361 | ||
| Restricted cash | 21,047 | 22,521 | ||
| Derivative asset | 13,682 | 1,574 | ||
| Prepayments and other assets | 546 | 4 | ||
| Non-current assets of discontinued operation | - | 237,645 | ||
| Total non-current assets | 3,676,133 | 3,707,339 | ||
| Total assets | $ | 4,095,114 | $ | 4,112,882 |
| Liabilities and Shareholders’ Equity | ||||
| Current liabilities | ||||
| Current portion of long-term debt, net | $ | 297,043 | $ | 117,126 |
| Trade accounts payable | 11,129 | 14,615 | ||
| Due to related parties | 5,607 | 3,542 | ||
| Accrued liabilities | 37,717 | 31,160 | ||
| Deferred revenue | 29,413 | 29,804 | ||
| Derivative liabilities | - | 18,114 | ||
| Current liabilities of discontinued operations | 103,514 | 29,130 | ||
| Total current liabilities | 484,423 | 243,491 | ||
| Long-term liabilities | ||||
| Long-term debt, net | 2,057,294 | 2,277,957 | ||
| Below market acquired charters | 53,531 | 65,923 | ||
| Deferred revenue | 499 | 634 | ||
| Non-current liabilities of discontinued operations | - | 181,908 | ||
| Total long-term liabilities | 2,111,324 | 2,526,422 | ||
| Total liabilities | 2,595,747 | 2,769,913 | ||
| Commitments and contingencies | ||||
| Total shareholders’ equity | 1,499,367 | 1,342,969 | ||
| Total liabilities and shareholders’ equity | $ | 4,095,114 | $ | 4,112,882 |
Unaudited Condensed Consolidated Statements of Cash Flows
(In thousands of United States Dollars)
| For the years ended |
||||||
| 2025 | 2024 | |||||
| Cash flows from operating activities of continuing operations: | ||||||
| Net income from operations | $ | 170,759 | $ | 193,634 | ||
| Less: Net income from discontinued operations | 57,365 | 138,444 | ||||
| Net income from continuing operations | 113,394 | 55,190 | ||||
| Adjustments to reconcile net income to net cash provided by operating activities: | ||||||
| Vessel depreciation and amortization | 87,213 | 76,454 | ||||
| Amortization and write-off of deferred financing costs | 3,738 | 3,028 | ||||
| Amortization / accretion of above / below market acquired charters | 22,586 | 17,052 | ||||
| Amortization of ineffective portion of derivatives | (210) | (209) | ||||
| Equity compensation expense | 6,395 | 6,918 | ||||
| Change in fair value of derivatives | (18,114) | 10,934 | ||||
| Unrealized bonds exchange differences | 19,775 | (9,848) | ||||
| Changes in operating assets and liabilities: | ||||||
| Trade accounts receivable | (4,748) | (1,799) | ||||
| Prepayments and other assets | (785) | 525 | ||||
| Due from related party | 1,131 | 716 | ||||
| Inventories | 445 | (1,904) | ||||
| Claims | (752) | - | ||||
| Trade accounts payable | (2,566) | 5,634 | ||||
| Due to related parties | 2,065 | 1,386 | ||||
| Accrued liabilities | 5,264 | 13,403 | ||||
| Deferred revenue | (526) | 7,337 | ||||
| Dry Docking - paid | (1,488) | - | ||||
| Net cash provided by operating activities of continuing operations | $ | 232,817 | $ | 184,817 | ||
| Cash flows from investing activities of continuing operations: | ||||||
| Vessel acquisitions, vessels under construction and improvements including time and bareboat charter agreements | (315,121) | (1,200,978) | ||||
| Proceeds from insurance claims | 573 | - | ||||
| Expenses paid for sale of vessels | (220) | (219) | ||||
| Net cash used in investing activities of continuing operations | $ | (314,768) | $ | (1,201,197) | ||
| Cash flows from financing activities of continuing operations: | ||||||
| Proceeds from long-term debt | 44,454 | 1,582,000 | ||||
| Deferred financing costs paid | (1,462) | (12,911) | ||||
| Payments of long-term debt | (120,868) | (780,910) | ||||
| Proceeds from offering, net of commissions paid | 207 | - | ||||
| Rights offering costs paid | (498) | (476) | ||||
| Dividends paid | (18,997) | (33,813) | ||||
| Net cash (used in) / provided by financing activities of continuing operations | $ | (97,164) | $ | 753,890 | ||
| Net decrease in cash, cash equivalents and restricted cash from continuing operations | $ | (179,115) | $ | (262,490) | ||
| Cash flows from discontinued operations | ||||||
| Operating activities | 9,245 | 55,030 | ||||
| Investing activities | 230,195 | 448,059 | ||||
| Financing activities | (100,610) | (108,902) | ||||
| Net increase in cash, cash equivalents and restricted cash from discontinued operations | 138,830 | 394,187 | ||||
| Net (decrease) / increase in cash, cash equivalents and restricted cash | (40,285) | 131,697 | ||||
| Cash, cash equivalents and restricted cash at the beginning of the year | $ | 335,175 | $ | 203,478 | ||
| Cash, cash equivalents and restricted cash at the end of the year | $ | 294,890 | $ | 335,175 | ||
| Supplemental cash flow information | ||||||
| Cash paid for interest | $ | 107,022 | $ | 131,870 | ||
| Non-Cash Investing and Financing Activities | ||||||
| Capital expenditures included in liabilities | 2,929 | 4,140 | ||||
| Capitalized dry-docking costs included in liabilities | 4,021 | 4,149 | ||||
| Deferred financing and offering costs included in liabilities | 60 | 86 | ||||
| Expenses for sale of vessels included in liabilities | 1,870 | 5,396 | ||||
| Dividends reinvestment plan issuance of new shares | 16,475 | - | ||||
| Seller’s credit agreements in connection with the acquisition of vessel owning companies | - | 134,764 | ||||
| Reconciliation of cash, cash equivalents and restricted cash | ||||||
| Cash and cash equivalents | 273,843 | 312,654 | ||||
| Restricted cash - non-current assets | 21,047 | 22,521 | ||||
| Total cash, cash equivalents and restricted cash shown in the statements of cash flows | $ | 294,890 | $ | 335,175 | ||
Appendix A
I. Discontinued Operations - Vessels
| Type | TEU | Memorandum of Agreement Date |
Delivery | |
| M/V Akadimos | Neo Panamax Container Vessel | 9,288 | ||
| M/V Long Beach Express | Panamax Container Vessel | 5,089 | ||
| M/V Seattle Express | Panamax Container Vessel | 5,089 | ||
| M/V Fos Express | Panamax Container Vessel | 5,089 | ||
| M/V Athenian | Neo Panamax Container Vessel | 9,954 | ||
| M/V Athos | Neo Panamax Container Vessel | 9,954 | ||
| M/V Aristomenis | Neo Panamax Container Vessel | 9,954 | ||
| M/V Hyundai Premium | Neo Panamax Container Vessel | 5,023 | ||
| M/V Hyundai Paramount | Neo Panamax Container Vessel | 5,023 | ||
| M/V Hyundai Prestige | Neo Panamax Container Vessel | 5,023 | ||
| M/V Hyundai Privilege | Neo Panamax Container Vessel | 5,023 | ||
| M/V Hyundai Platinum | Neo Panamax Container Vessel | 5,023 | ||
| M/V Manzanillo Express | Neo Panamax Container Vessel | 13,312 | ||
| M/V Buenaventura Express | Neo Panamax Container Vessel | 13,696 |
II. Discontinued Operations - Unaudited Condensed Consolidated Statements of Comprehensive Income
(In thousands of United States Dollars)
| For the three-month periods ended |
For the years ended |
|||||||
| 2025 | 2024 | 2025 | 2024 | |||||
| Revenues | 4,113 | 20,299 | 28,886 | 100,439 | ||||
| Expenses / (income), net: | ||||||||
| Voyage expenses | 95 | 387 | 662 | 2,114 | ||||
| Vessel operating expenses | 1,056 | 4,382 | 6,390 | 22,536 | ||||
| Vessel operating expenses - related party | 115 | 655 | 836 | 3,443 | ||||
| Vessel depreciation and amortization | 397 | 2,426 | 6,983 | 20,720 | ||||
| Gain on sale of vessels | (7,492) | (72,205) | (53,705) | (103,807) | ||||
| Operating income, net | 9,942 | 84,654 | 67,720 | 155,433 | ||||
| Other (expense) / income, net: | ||||||||
| Interest expense and finance cost | (1,776) | (3,321) | (10,572) | (17,203) | ||||
| Other (expense) / income, net | (1) | 133 | 217 | 214 | ||||
| Total other expense, net | (1,777) | (3,188) | (10,355) | (16,989) | ||||
| Net income from discontinued operations | 8,165 | 81,466 | 57,365 | 138,444 | ||||
During the year ended
| Vessel | MOA Date | Delivery date |
| M/V Hyundai Privilege | ||
| M/V Hyundai Platinum | ||
| M/V Manzanillo Express |
III. Discontinued Operations - Unaudited Condensed selected balance sheets information
(In thousands of United States Dollars)
| As of 2025 |
As of 2024 |
|||
| Cash and cash equivalents | $ | 680 | $ | 1,371 |
| Trade accounts receivable | 92 | 800 | ||
| Inventories | - | 417 | ||
| Prepayments and other assets | 1,205 | 1,226 | ||
| Claims | 49 | 49 | ||
| Assets held for sale | 122,212 | 71,720 | ||
| Current assets of discontinued operations | 124,238 | 75,583 | ||
| Vessels, net | - | 237,645 | ||
| Non-current assets of discontinued operations | - | 237,645 | ||
| Current portion of long-term debt, net | - | 11,257 | ||
| Trade accounts payable | 2,446 | 3,530 | ||
| Accrued liabilities | 9,017 | 13,440 | ||
| Deferred revenue | - | 903 | ||
| Liabilities associated with vessel held for sale | 92,051 | - | ||
| Current liabilities of discontinued operations | 103,514 | 29,130 | ||
| Long-term liabilities | - | 172,172 | ||
| Below market acquired charters | - | 9,736 | ||
| Non-current liabilities of discontinued operations | - | 181,908 |
On
On

![]()
Source: Capital Clean Energy Carriers Corp.