Capital Clean Energy Carriers Corp. Announces First Quarter 2026 Financial Results
Key Highlights
- Completed an offering of €250.0 million in unsecured bonds with a seven-year maturity listed on the Athens Exchange (“ATHEX”)
- Agreed to divest 49% stake in the LNG/C Amore Mio I, formed a Joint Venture company with an affiliate of the
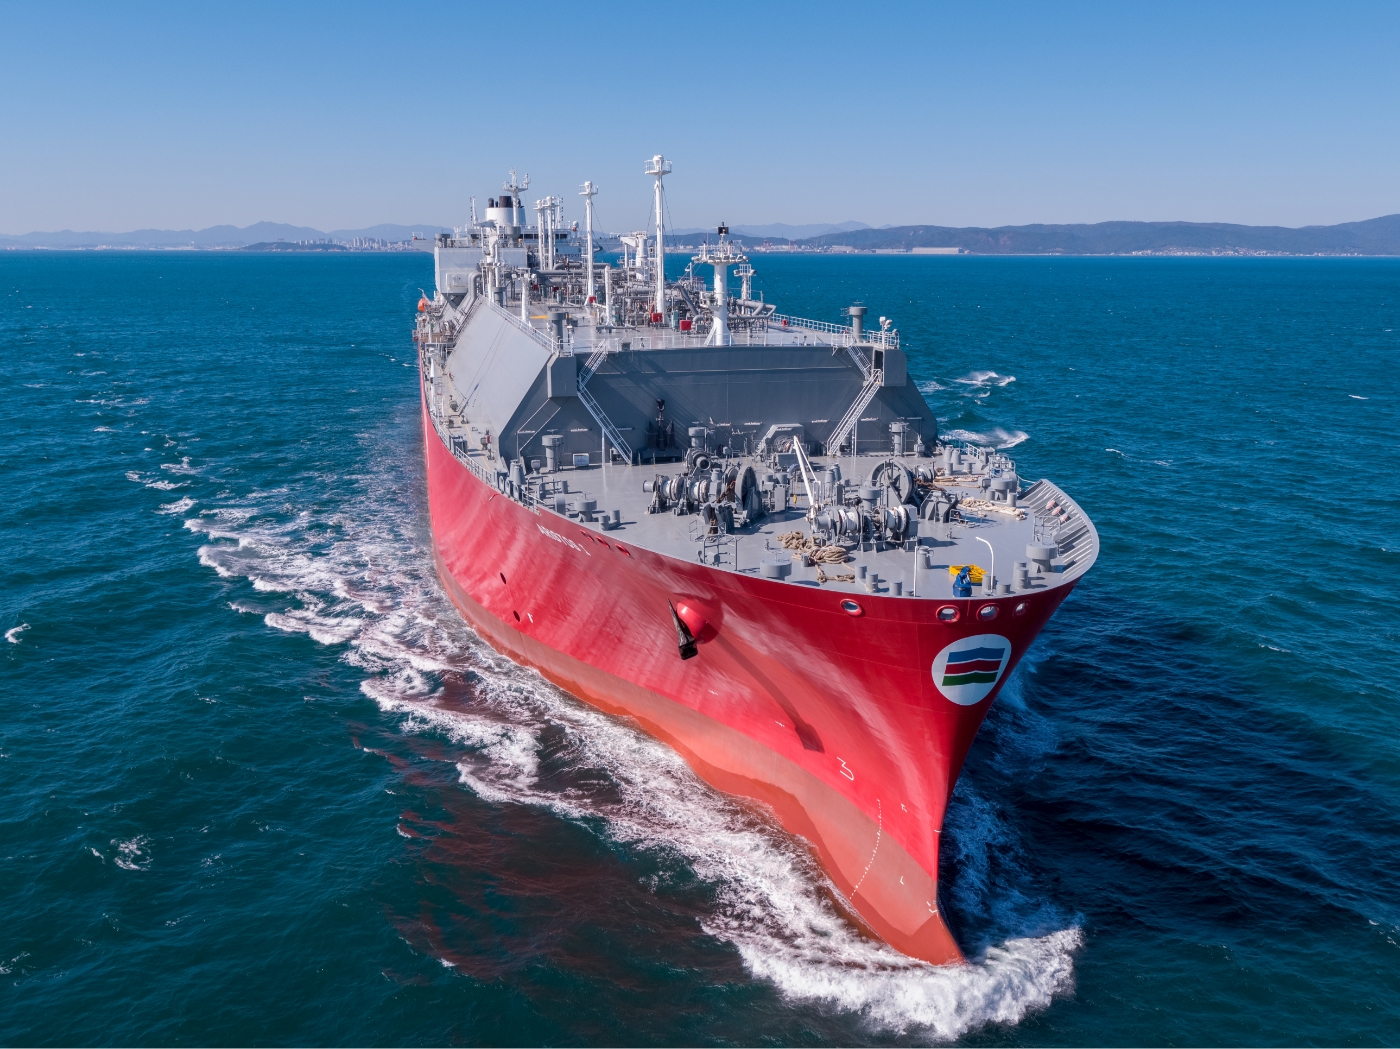
BGN Group and secured a 10-year time charter - Took delivery of our second LCO2/multi-gas carrier, the Amadeus
- Brought forward the delivery of three LNG/Cs under construction
- Announced a dividend of
$0.15 per share for the first quarter of 2026 - Board approved
$20.0 million share buyback program
Key Financial Highlights (continuing operations)
| Three-month periods ended |
|||
| 2026 | 2025 | (Decrease) / Increase | |
| Revenues | (3.9%) | ||
| Expenses | 25.7% | ||
| Interest expense and finance cost | (17.3%) | ||
| Net Income | (44.0%) | ||
| Average number of vessels1 | 14.0 | 13.0 | 7.7% |
_____________________
1 Average number of vessels is measured by aggregating the number of days each vessel was part of our fleet during the period and dividing such aggregate number by the number of calendar days in the period.
Management Commentary
Mr.
“During the first quarter, the Company continued to deliver on our strategy to build a leading gas transportation platform, generating both robust cash flows and further strengthening our financial position through a successful bond offering. Post quarter end, we executed an innovative transaction, which not only highlighted our ability to attract a co-investment with a major energy trading partner, but also enhanced the quality and diversification of our charter portfolio.
“As a result, the average firm contract duration for our LNG/Cs stands at 6.9 years, representing approximately
“The ongoing geopolitical tensions in the
“Last but not least, during the quarter Mr.
Fleet Update
On
During the period, we agreed with the shipyard to bring forward the delivery of the following three LNG/Cs currently under construction:
| LNG/C | Current expected delivery date | Previous delivery date |
| Archimidis | ||
| Agamemnon | ||
| Alcaios I |
The acquisition of LNG/C Archimidis is expected to be financed by cash on hand and a new JOLCO facility for an amount of
The acquisition of LNG/C Agamemnon is expected to be financed by cash on hand and a new senior secured bridge loan facility of $216.0 million. The bridge facility is expected to be refinanced upon the drawdown in
Both facilities remain subject to final long form documentation.
Divestment of 49% Stake in the LNG/C Amore Mio I, Formation of a Joint Venture Company With an Affiliate of the
On
The Joint Venture has secured a 10-year time charter (with two three-year extension options) of the vessel to BGN INT DMCC commencing simultaneously with the acquisition of the vessel and expected, if all options are exercised, to generate aggregate revenues of up to approximately $485.6 million and extending up to 2043.
The Joint Venture will be effected through BM Capital HoldCo LLC, a newly formed Marshall Islands limited liability company, in which CCEC holds a 51% interest and BMarine Shipping Investment FZCO holds the remaining 49%. BM Capital LLC, a wholly owned subsidiary of BM Capital HoldCo LLC, will acquire the vessel for $230.0 million.
The existing financing on the vessel is expected to be refinanced upon acquisition of the vessel in the first quarter of 2027.
Under-Construction Fleet Update
The Company’s under-construction fleet includes nine latest-generation LNG/Cs (referred to below as the “Newbuild LNG/Cs”) plus six dual-fuel medium gas carriers and two handy LCO2/multi-gas carriers (referred to below as the “Gas Fleet”). The following table sets out the Company’s schedule of expected capex payments for its under-construction fleet:
| Q2 26 | Q3 26 | Q4 26 | Q1 27 | Q2 27 | Q3 27 | Q4 27 | Q1 28 | Q2 28 | Q3 28 | Q4 28 | Q1 29 | Total | |
| Newbuild LNG/Cs | 541.1 | 149.7 | 0.00 | 456.9 | 24.7 | 0.0 | 74.1 | 0.0 | 49.4 | 186.4 | 0.0 | 372.8 | 1,855.1 |
| Gas Fleet | 61.2 | 115.4 | 0.00 | 183.9 | 0.00 | 35.9 | 0.0 | 0.0 | 0.0 | 0.0 | 0.0 | 0.0 | 396.4 |
| Total | 602.3 | 265.1 | 0.00 | 640.8 | 24.7 | 35.9 | 74.1 | 0.0 | 49.4 | 186.4 | 0.0 | 372.8 | 2,251.5 |
Overview of First Quarter 2026 Results
Net income for the quarter ended
Total revenues for the quarter ended
Total expenses for the quarter ended
Total expenses for the first quarter of 2026 also include vessel depreciation and amortization of
Total other expenses, net for the quarter ended
Company Capitalization
As of
As of
As of
As of
Appointment of new Chairman and new role of Vice-Chairman
On
Issuance of €250.0 million unsecured bonds (ATHEX: CCECB1)
On
The Bonds will mature in 2033 and have a coupon of 3.75%, payable semi-annually.
Part of the proceeds of the Bonds were used on
Dividend Reinvestment Plan (“DRIP”)
The Company has implemented a Dividend Reinvestment Plan to provide our shareholders with a convenient and economical way to reinvest cash dividends to purchase our common shares. The DRIP is open to our existing shareholders and investors who will become our shareholders in the future outside of the DRIP. In
At
Share Repurchase Program
Our Board of Directors approved a share repurchase program, providing the Company with authorization to repurchase up to $20.0 million of the Company’s common shares, effective for a period of two years. The Company may repurchase these shares in the open market or in privately negotiated transactions, at times and prices that are considered to be appropriate by the Company.
Quarterly Dividend Distribution
On
LNG Market Update
The first quarter of 2026 in LNG shipping was inevitably defined by the conflict in the
Market conditions shifted sharply following the U.S.–Israeli strike on
At the same time, uncertainty led to LNG/C vessel relet supply length being pulled back, which in combination with the increase in tonne-mile demand, led to a spike in charter rates from around
As of quarter-end, 296 LNG carriers were on order, with 20 vessels delivered during the first quarter of 2026. Of the total orderbook, analysts estimate that only 36 vessels (or 12.1%) remain without committed employment, six of which are controlled by the Company.
LPG Market Update
CCEC controls a fleet of ten LPG/ammonia/LCO2 carriers (of which two are currently on the water) comprising four LCO₂/multi-gas carriers and six dual-fuel medium gas (‘MGC’) carriers. Deliveries commenced in
Market conditions across both the MGC and Handy segments continued to demonstrate strong underlying fundamentals. Resilient demand, combined with operational flexibility, resulted in improved charter rates.
The MGC segment remained structurally tight throughout the first quarter of 2026, as strong demand from traders seeking to secure time charter coverage absorbed virtually all available tonnage in the
The Handy segment benefited from spillover strength, with vessels increasingly utilized as a critical alternative for LPG transportation, while also competing with higher-value petrochemical gas cargoes. The fleet once again demonstrated the importance of versatility, with its ability to respond to evolving trade patterns enabling optimization, increased utilization, and enhanced returns. Geopolitical disruption in the Arabian Gulf has reduced near-term market liquidity, while has also materially constraining effective global vessel supply. At the same time, ongoing disruption to global supply chains is driving new trade flows and increasing tonne-mile demand, as cargoes are rerouted, sourced from alternative origins and transported over longer distances. This structural shift continues to support vessel utilization and freight rates across LPG, ammonia and petrochemical markets. Time charter rates remained firm during the quarter, with standard semi-refrigerated handy-sized vessels assessed at approximately
Conference Call and Webcast
As previously announced, today,
Conference Call Details
Participants should dial into the call 10 minutes before the scheduled time using the following numbers: 877 405 1226 (US Toll-Free Dial In) or +1 201 689 7823 (US and Standard International Dial In). Please quote “Capital Clean Energy” to the operator and/or conference ID 13759970. Click here for participant International Toll-Free access numbers.
Alternatively, participants can register for the call using the Call Me option for a faster connection to join the conference call. You can enter your phone number and let the system call you right away.
Slides and Audio Webcast
There will also be a live, and then archived, webcast of the conference call and accompanying slides, available through the Company’s website. To listen to the archived audio file, visit our website http://ir.capitalcleanenergycarriers.com and click on Webcasts & Presentations under our Investor Relations page. Participants to the live webcast should register on the website approximately 10 minutes prior to the start of the webcast.
About
For more information about the Company, please visit: www.capitalcleanenergycarriers.com
Forward-Looking Statements
The statements in this press release that are not historical facts, including, among other things, statements related to CCEC’s delivery of strategic goals, ability to pursue growth opportunities and expectations or objectives regarding future vessel deliveries and share repurchase, charter rate and revenue expectations, are forward-looking statements (as such term is defined in Section 21E of the Securities Exchange Act of 1934, as amended). These forward-looking statements involve risks and uncertainties that could cause the stated or forecasted results to be materially different from those anticipated. For a discussion of factors that could materially affect the outcome of forward-looking statements and other risks and uncertainties, see “Risk Factors” in our annual report filed with the
Contact Details:
Investor Relations / Media
EVP Investor Relations
Tel. +44 (770) 368 4996
E-mail: b.gallagher@capitalmaritime.com
Capital
Tel. +1-212-661-7566
E-mail: ccec@capitallink.com
Unaudited Condensed Consolidated Statements of Comprehensive Income
(In thousands of United States Dollars, except for number of shares and earnings per share)
| For the three-month periods ended |
||||
| 2026 |
2025 |
|||
| Revenues | 98,009 | 102,037 | ||
| Expenses: | ||||
| Voyage expenses | 6,157 | 1,068 | ||
| Vessel operating expenses | 19,566 | 14,001 | ||
| Vessel operating expenses - related parties | 2,487 | 2,280 | ||
| General and administrative expenses | 3,465 | 4,129 | ||
| Vessel depreciation and amortization | 22,657 | 21,769 | ||
| Operating income, net | 43,677 | 58,790 | ||
| Other (expense) / income, net: | ||||
| Interest expense and finance cost | (23,034 | ) | (27,769 | ) |
| Other (expense) / income, net | (2,374 | ) | 1,648 | |
| Total other expense, net | (25,408 | ) | (26,121 | ) |
| Net income from continuing operations | 18,269 | 32,669 | ||
| Net income from discontinued operations | 3,765 | 48,048 | ||
| Net income from operations | 22,034 | 80,717 | ||
| Net income attributable to unvested shares | - | 1,418 | ||
| Net income attributable to common shareholders | 22,034 | 79,299 | ||
| Net income from continuing operations per: | ||||
| • Common shares, basic and diluted | 0.30 | 0.55 | ||
| Weighted-average shares outstanding: | ||||
| • Common shares, basic | 59,984,836 | 58,717,313 | ||
| • Common shares, diluted | 60,121,845 | 58,717,313 | ||
| Net income from discontinued operations per: | ||||
| • Common shares, basic and diluted | 0.06 | 0.80 | ||
| Weighted-average shares outstanding: | ||||
| • Common shares, basic | 59,984,836 | 58,717,313 | ||
| • Common shares, diluted | 60,121,845 | 58,717,313 | ||
| Net income from operations per: | ||||
| • Common shares, basic and diluted | 0.37 | 1.35 | ||
| Weighted-average shares outstanding: | ||||
| • Common shares, basic | 59,984,836 | 58,717,313 | ||
| • Common shares, diluted | 60,121,845 | 58,717,313 | ||
Unaudited Condensed Consolidated Balance Sheets
(In thousands of United States Dollars)
| As of 2026 |
As of 2025 |
|||
| Assets | ||||
| Current assets | ||||
| Cash and cash equivalents | 525,309 | 273,843 | ||
| Restricted cash | 7,021 | 7,024 | ||
| Trade accounts receivable | 12,852 | 8,437 | ||
| Prepayments and other assets | 8,283 | 7,437 | ||
| Inventories | 3,984 | 3,982 | ||
| Claims | 1,044 | 1,044 | ||
| Current assets of discontinued operations | 1,203 | 124,238 | ||
| Total current assets | 559,696 | 426,005 | ||
| Fixed assets | ||||
| Advances for vessels under construction - related party | 54,000 | 54,000 | ||
| Vessels, net and vessels under construction | 3,589,091 | 3,516,778 | ||
| Total fixed assets | 3,643,091 | 3,570,778 | ||
| Other non-current assets | ||||
| Above market acquired charters | 58,029 | 66,597 | ||
| Deferred charges, net | 5,388 | 3,483 | ||
| Restricted cash | 14,022 | 14,023 | ||
| Derivative asset | 11,037 | 13,682 | ||
| Prepayments and other assets | 2,447 | 546 | ||
| Total non-current assets | 3,734,014 | 3,669,109 | ||
| Total assets | 4,293,710 | 4,095,114 | ||
| Liabilities and shareholders’ equity | ||||
| Current liabilities | ||||
| Current portion of long-term debt, net | 289,489 | 122,144 | ||
| Trade accounts payable | 20,728 | 11,129 | ||
| Due to related parties | 4,542 | 5,607 | ||
| Accrued liabilities | 47,915 | 37,717 | ||
| Deferred revenue | 25,792 | 29,413 | ||
| Current liabilities of discontinued operations | 12,803 | 103,514 | ||
| Total current liabilities | 401,269 | 309,524 | ||
| Long-term liabilities | ||||
| Long-term debt, net | 2,313,453 | 2,232,193 | ||
| Below market acquired charters | 50,492 | 53,531 | ||
| Deferred revenue | 435 | 499 | ||
| Derivative liabilities | 11,432 | - | ||
| Total long-term liabilities | 2,375,812 | 2,286,223 | ||
| Total liabilities | 2,777,081 | 2,595,747 | ||
| Total shareholders’ equity | 1,516,629 | 1,499,367 | ||
| Total liabilities and shareholders’ equity | 4,293,710 | 4,095,114 | ||
Unaudited Condensed Consolidated Statements of Cash Flows
(In thousands of United States Dollars)
| For the three-month periods ended |
||||
| 2026 | 2025 | |||
| Cash flows from operating activities of continuing operations: | ||||
| Net income from operations | 22,034 | 80,717 | ||
| Less: Net income from discontinued operations | 3,765 | 48,048 | ||
| Net income from continuing operations | 18,269 | 32,669 | ||
| Adjustments to reconcile net income to net cash provided by operating activities: | ||||
| Vessel depreciation and amortization | 22,657 | 21,769 | ||
| Amortization and write-off of deferred financing costs | 1,046 | 913 | ||
| Amortization / accretion of above / below market acquired charters | 5,529 | 5,402 | ||
| Amortization of ineffective portion of derivatives | (51 | ) | (51 | ) |
| Equity compensation expense | 1,577 | 1,576 | ||
| Change in fair value of derivatives | - | (6,594 | ) | |
| Unrealized bonds exchange differences | (3,081 | ) | 6,325 | |
| Loss on foreign exchange forward contracts | 1,956 | - | ||
| Unrealized cash, cash equivalents and restricted cash exchange differences | 3,557 | - | ||
| Changes in operating assets and liabilities: | ||||
| Trade accounts receivable | (4,415 | ) | (1,538 | ) |
| Prepayments and other assets | (2,749 | ) | (1,018 | ) |
| Due from related party | - | 1,131 | ||
| Inventories | (2 | ) | 350 | |
| Trade accounts payable | 2,223 | (4,433 | ) | |
| Due to related parties | (1,065 | ) | 737 | |
| Accrued liabilities | 9,135 | 887 | ||
| Deferred revenue | (3,685 | ) | (3,387 | ) |
| Dry docking - paid | (1,753 | ) | - | |
| Net cash provided by operating activities of continuing operations | 49,148 | 54,738 | ||
| Cash flows from investing activities of continuing operations: | ||||
| Vessel acquisitions, vessels under construction and improvements | (94,855 | ) | (51,027 | ) |
| Net cash used in investing activities of continuing operations | (94,855 | ) | (51,027 | ) |
| Cash flows from financing activities of continuing operations: | ||||
| Proceeds from long-term debt | 299,604 | - | ||
| Deferred financing costs paid | (507 | ) | (104 | ) |
| Payments of long-term debt | (31,074 | ) | (30,107 | ) |
| Rights offering costs paid | (34 | ) | (101 | ) |
| Dividends paid | (3,352 | ) | (8,996 | ) |
| Net cash provided by / (used in) financing activities of continuing operations | 264,637 | (39,308 | ) | |
| Net increase / (decrease) in cash, cash equivalents and restricted cash from continuing operations | 218,930 | (35,597 | ) | |
| Cash flows from discontinued operations | ||||
| Operating activities | 770 | 2,382 | ||
| Investing activities | 119,694 | 120,683 | ||
| Financing activities | (84,375 | ) | (2,893 | ) |
| Net increase in cash, cash equivalents and restricted cash from discontinued operations | 36,089 | 120,172 | ||
| Net increase in cash, cash equivalents and restricted cash | 255,019 | 84,575 | ||
| Effect of exchange rate changes on cash, cash equivalents and restricted cash | (3,557 | ) | - | |
| Cash, cash equivalents and restricted cash at the beginning of the period | 294,890 | 335,175 | ||
| Cash, cash equivalents and restricted cash at the end of the period | 546,352 | 419,750 | ||
| Supplemental cash flow information | ||||
| Cash paid for interest | 20,396 | 27,117 | ||
| Non-Cash Investing and Financing Activities | ||||
| Capital expenditures included in liabilities | 2,925 | 3,992 | ||
| Deferred financing and offering costs included in liabilities | 8,251 | - | ||
| Capitalized dry-docking costs included in liabilities | 4,272 | 3,129 | ||
| Expenses for sale of vessels included in liabilities | 3,911 | 8,428 | ||
| Dividends reinvestment plan issuance of new shares | 5,714 | - | ||
| Reconciliation of cash, cash equivalents and restricted cash | ||||
| Cash and cash equivalents | 525,309 | 398,221 | ||
| Restricted cash - current assets | 7,021 | - | ||
| Restricted cash - non-current assets | 14,022 | 21,529 | ||
| Total cash, cash equivalents and restricted cash shown in the statements of cash flows | 546,352 | 419,750 | ||
Appendix A
I. Discontinued Operations - Vessels
| Type | TEU | Memorandum of Agreement Date | Delivery | |
| M/V Akadimos | Neo Panamax Container Vessel | 9,288 | ||
| M/V Long Beach Express | Panamax Container Vessel | 5,089 | ||
| M/V Seattle Express | Panamax Container Vessel | 5,089 | ||
| M/V Fos Express | Panamax Container Vessel | 5,089 | ||
| M/V Athenian | Neo Panamax Container Vessel | 9,954 | ||
| M/V Athos | Neo Panamax Container Vessel | 9,954 | ||
| M/V Aristomenis | Neo Panamax Container Vessel | 9,954 | ||
| M/V Hyundai Premium | Neo Panamax Container Vessel | 5,023 | ||
| M/V Hyundai Paramount | Neo Panamax Container Vessel | 5,023 | ||
| M/V Hyundai Prestige | Neo Panamax Container Vessel | 5,023 | ||
| M/V Hyundai Privilege | Neo Panamax Container Vessel | 5,023 | ||
| M/V Hyundai Platinum | Neo Panamax Container Vessel | 5,023 | ||
| M/V Manzanillo Express | Neo Panamax Container Vessel | 13,312 | ||
| M/V Buenaventura Express | Neo Panamax Container Vessel | 13,696 |
II. Discontinued Operations - Unaudited Condensed Consolidated Statements of Comprehensive Income
(In thousands of United States Dollars)
| For the three-month periods ended |
||||
| 2026 | 2025 | |||
| Revenues | 719 | 9,826 | ||
| Expenses / (income), net: | ||||
| Voyage expenses | 18 | 210 | ||
| Vessel operating expenses | 24 | 2,372 | ||
| Vessel operating expenses - related party | 13 | 297 | ||
| Vessel depreciation and amortization | - | 2,426 | ||
| Gain on sale of vessels | (4,171 | ) | (46,213 | ) |
| Operating income, net | 4,835 | 50,734 | ||
| Other (expense) / income, net: | ||||
| Interest expense and finance cost | (1,074 | ) | (2,955 | ) |
| Other income, net | 4 | 269 | ||
| Total other expense, net | (1,070 | ) | (2,686 | ) |
| Net income from discontinued operations | 3,765 | 48,048 | ||
During the three-month period ended
III. Discontinued Operations - Unaudited Condensed selected balance sheets information
(In thousands of United States Dollars)
| As of 2026 |
As of 2025 |
|||
| Cash and cash equivalents | 38 | 680 | ||
| Trade accounts receivable | 249 | 92 | ||
| Prepayments and other assets | 867 | 1,205 | ||
| Claims | 49 | 49 | ||
| Assets held for sale | - | 122,212 | ||
| Current assets of discontinued operations | 1,203 | 124,238 | ||
| Trade accounts payable | 4,065 | 2,446 | ||
| Accrued liabilities | 8,738 | 9,017 | ||
| Liabilities associated with vessel held for sale | - | 92,051 | ||
| Current liabilities of discontinued operations | 12,803 | 103,514 | ||
On

![]()
Source: Capital Clean Energy Carriers Corp.