Capital Clean Energy Carriers Corp. Announces Second Quarter 2026 Financial Results
Key Highlights
- Took delivery of two Liquefied Natural Gas Carriers (“LNG/Cs”) along with one Handy Liquefied CO2
Multi-Gas Carrier (“HMG/C”) and two dual-fuel Medium Gas Carriers (“MG/Cs”) - Agreed to divest a 49% stake in the LNG/C Amore Mio I, formed a joint venture company with an affiliate of the BGN Group and secured a 10-year time charter
- Joint venture announced for the construction and operation of a dual-fuel Liquefied Natural Gas Bunkering Vessel (“LNGB/V”) with
CMA CGM S.A. (“CMA CGM”) - Secured index-linked employment for LNG/C Alcaios I for 18 months
- Declared a dividend of
$0.15 per share for the second quarter of 2026 - Commenced share repurchase program for up to $20.0 million
Management Commentary
Mr.
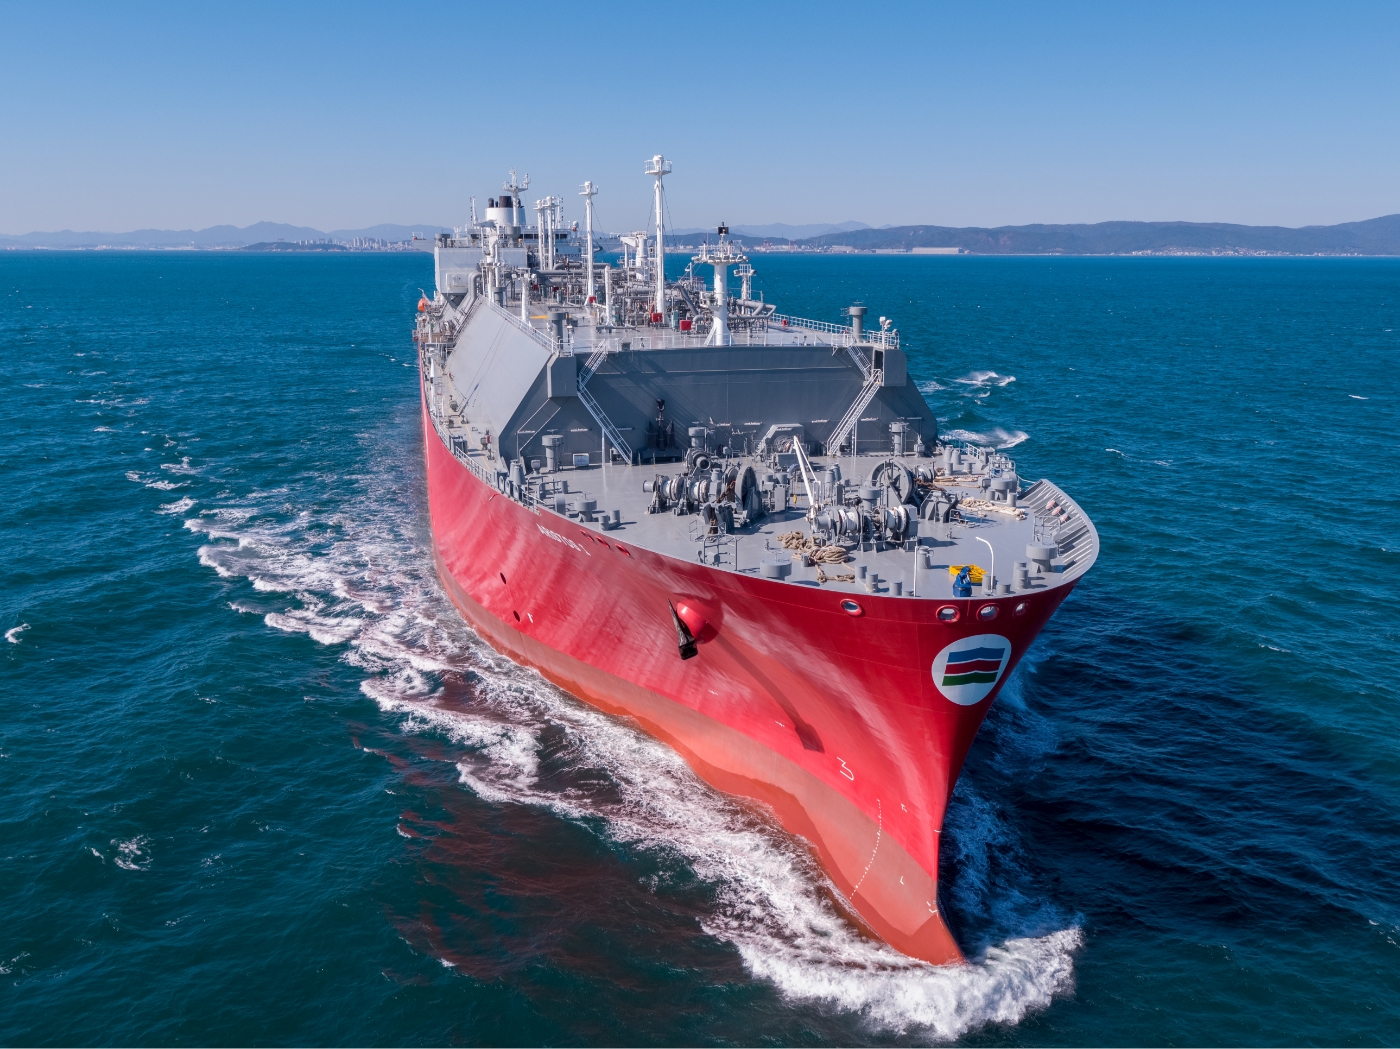
After taking delivery of two LNG/Cs, two HMG/Cs and two MG/Cs since the beginning of the year, our fleet in the water comprises 14 latest-generation LNG/Cs, two HMG/Cs, two MG/Cs and one legacy Neo-Panamax container vessel, with another seven LNG/Cs, two HMG/Cs, four MG/Cs and one LNGB/V on order. This makes CCEC the largest US-listed LNG shipping company with a substantial footprint in the LPG market and contracted fleet growth through 2029. We have a diversified customer base with approximately
Fleet Update - LNG/Cs
The Company took delivery of the LNG/C Archimidis (
The acquisition of the LNG/C Archimidis was funded through cash on hand together with a new eight-year JOLCO facility of
The LNG/C Alcaios I, which is expected to be delivered from the shipyard on
Fleet Update - HMG/Cs and MG/Cs
The Company took delivery of its second HMG/C, the Amadeus (
On
On
The acquisitions of the MG/Cs Aristogenis and Aridaios were financed through cash on hand and seven-year sale and leaseback facilities of $54.7 million for each vessel. Under the facilities, the Company may borrow an additional amount of up to $11.7 million for each vessel if the vessel secures employment for longer than 36 months.
Under-Construction Fleet Update
The Company’s under-construction fleet includes seven latest-generation LNG/Cs (referred to below as the “Newbuild LNG/Cs”), four MG/Cs and two HMG/Cs (referred to below as the “Gas Fleet”) and one LNGB/V (50% ownership through joint venture). The following table sets out the Company’s schedule of expected capex payments for its under-construction fleet:
| ($ mn) | Q3 26 | Q4 26 | Q1 27 | Q2 27 | Q3 27 | Q4 27 | Q1 28 | Q2 28 | Q3 28 | Q4 28 | Q1 29 | Total |
| Newbuild LNG/Cs | 149.7 | - | 456.9 | 24.7 | 49.4 | 24.7 | 24.7 | 24.7 | 186.4 | - | 372.8 | 1,314.0 |
| Gas Fleet | 121.9 | - | 183.9 | - | 35.8 | - | - | - | - | - | - | 341.6 |
| LNGB/V (50%) | - | 4.1 | - | 4.1 | - | 4.1 | 4.1 | - | 24.8 | - | - | 41.4 |
| Total | 271.6 | 4.1 | 640.8 | 28.8 | 85.2 | 28.8 | 28.8 | 24.7 | 211.2 | - | 372.8 | 1,697.0 |
On
On April 15, 2026, the Company announced that it has agreed to sell in the first quarter of 2027 the LNG/C Amore Mio I (2023-built, 174,000 CBM) to a subsidiary of a joint venture company (the “LNG/C Joint Venture”) owned 51% by CCEC and 49% by a company affiliated with global energy trader BGN. The LNG/C Joint Venture has secured a 10-year time charter (with two three-year extension options) of the vessel to BGN INT DMCC, commencing simultaneously with the acquisition of the vessel. The LNG/C Joint Venture will be effected through BM Capital HoldCo LLC, a newly formed Marshall Islands limited liability company, in which CCEC holds a 51% interest and an affiliated company of BGN holds the remaining 49%. BM Capital LLC, a wholly owned subsidiary of BM Capital HoldCo LLC, will acquire the vessel for $230.0 million.
The existing financing on the vessel is expected to be refinanced upon acquisition of the vessel in the first quarter of 2027.
Overview of Second Quarter 2026 Financial Results
Key Financial Highlights (continuing operations)
| Three-month periods ended |
||||
| 2026 | 2025 | Increase / (Decrease) |
||
| Revenues | 8 | % | ||
| Expenses | 20 | % | ||
| Interest expense and finance cost | (3 | )% | ||
| Net Income | (2 | )% | ||
| Average number of vessels1 | 15.5 | 13.0 | 19 | % |
______________________
1 Average number of vessels is measured by aggregating the number of days each vessel was part of our fleet during the period and dividing such aggregate number by the number of calendar days in the period.
Net income for the quarter ended
Total revenues for the quarter ended
Total expenses for the quarter ended
Vessel operating expenses during the second quarter of 2026 amounted to
Total expenses for the second quarter of 2026 also include vessel depreciation and amortization of
Total other expenses, net for the quarter ended
Quarterly Dividend Distribution
On
Overview of the six-month period ended
Key Financial Highlights (continuing operations)
| Six-month periods ended |
||||
| 2026 | 2025 | Increase / (Decrease) |
||
| Revenues | 2 | % | ||
| Expenses | 23 | % | ||
| Interest expense and finance cost | (10 | %) | ||
| Net Income | (24 | %) | ||
| Average number of vessels | 14.7 | 13.0 | 13 | % |
Net income for the six-month period ended
Total revenues for the six-month period ended
Total expenses for the six-month period ended
Vessel operating expenses during the six-month period ended
Total expenses for the six-month period ended
Total other expenses, net for the six-month period ended
Issuance of €250.0 million unsecured bonds (ATHEX: CCECB1)
On February 25, 2026, CCEC successfully completed an unsecured bond offering of €250.0 million (the “Bonds”). The Bonds were admitted to trading in the fixed income securities category of the Regulated Market of the Athens Exchange (ATHEX) on February 26, 2026.
The Bonds will mature in 2033 and have a coupon of 3.75%, payable semi-annually.
Part of the proceeds of the Bonds was used on April 22, 2026, to prepay the outstanding €150.0 million unsecured bonds issued in 2021. The remaining amount was used to finance part of CCEC’s capital expenditure and for general corporate purposes.
Company Capitalization
As of
As of
As of
| For the twelve-month period ending |
Amount ($ million) |
| 2027 | 137.4 |
| 2028 | 131.4 |
| 2029 | 134.2 |
| 2030 | 416.1 |
| 2031 | 600.1 |
| Thereafter | 1,535.9 |
| Total | 2,955.1 |
As of
Hedging Program
At the end of the first quarter of 2026, approximately 69% of CCEC's debt portfolio was exposed to floating interest rates, with the remaining 31% at fixed rates. The Company executed during the second and third quarters of 2026, three-year interest rate hedging transactions in the form of zero-cost collars covering
Dividend Reinvestment Plan (“DRIP”)
The Company has implemented a Dividend Reinvestment Plan to provide our shareholders with a convenient and economical way to reinvest cash dividends to purchase our common shares. The DRIP is open to our existing shareholders and investors who will become our shareholders in the future outside of the DRIP. During the six-month period ended
As of
Share Repurchase Program
In
During the period to
LNG Market Update
The first half of 2026 in the LNG shipping was shaped by the conflict in the
Short-term fixture activity in 2026 reached an all-time high, with spot fixtures in the January-to-May period surpassing all prior years on record, while independent owners have increased their share of this activity relative to vessels being relet into the market by charterers. Ordering activity remained high after a rush in contracting activity late in the fourth quarter of 2025 and in the first month of 2026. A total of 49 LNG carriers were ordered during the first half of the year with 23 vessels being ordered in the second quarter of 2026. This contracting rise reflects confidence within the shipping industry that the liquefaction projects scheduled to come on stream before 2030 will require increased shipping capacity. Newbuild LNG carrier pricing has increased to over
As of quarter-end, 338 LNG carriers were on order, with 22 vessels delivered during the second quarter of 2026 and 42 in total for the first half of 2026. Of the total orderbook, analysts estimate that only 48 vessels (or 14.2%) remain without committed employment, six of which are controlled by the Company.
LPG Market Update
Market conditions across both the MGC and Handy segments continued to strengthen during the second quarter, building on the firm fundamentals established earlier in the year. The continued effective closure of the
Conference Call and Webcast
On Wednesday, 29th
Participants can access the conference call through an audio webcast of a conference call:
Slides and Audio Webcast
There will be a live webcast and slides which will be available during the call. You can register and view the call through the following link: https://ccec.engagestream.euronext.com/2026-07-29-p15bn1nrrw
A replay will be available on demand through the same link.
Conference call participants will need to register online prior to the conference call via the link below.
https://engagestream.euronext.com/ccec/2026-07-29-p15bn1nrrw/dial-in
Dial-in details will be available when registered. After registering you’ll receive the number to call, plus your personal ID. We advise you to call in 5 minutes before the conference call starts. If you want to ask a question, you can press #5 on your telephone keypad. If you want to retract your question, please press #6. Information on how to submit questions will be given at the beginning of the session.
The presentation material which will be used can be downloaded from www.capitalcleanenergycarriers.com
About Capital Clean Energy Carriers Corp.
Capital Clean Energy Carriers Corp. (NASDAQ: CCEC), an international shipping company, is a leading platform of gas carriage solutions with a focus on energy transition. CCEC’s in-the-water fleet comprises 19 high specification vessels, including 14 latest-generation LNG/Cs, one legacy Neo-Panamax container vessel and two LCO2 multi gas and two MG/C gas carriers. In addition, CCEC’s under-construction fleet includes seven additional latest-generation LNG/Cs, four MG/Cs, two HMG/Cs and one LNGB/V to be delivered between the third quarter of 2026 and the first quarter of 2029.
For more information about the Company, please visit: www.capitalcleanenergycarriers.com
Forward-Looking Statements
The statements in this press release that are not historical facts, including, among other things, statements related to CCEC’s delivery of strategic goals, ability to pursue growth opportunities and expectations or objectives regarding future vessel deliveries, charter rate and revenue streams and expectations and share repurchase, are forward-looking statements (as such term is defined in Section 21E of the Securities Exchange Act of 1934, as amended). These forward-looking statements involve risks and uncertainties that could cause the stated or forecasted results to be materially different from those anticipated. For a discussion of factors that could materially affect the outcome of forward-looking statements and other risks and uncertainties, see “Risk Factors” in our annual report filed with the SEC on Form 20-F for the year ended December 31, 2025, filed on April 27, 2026. Unless required by law, CCEC expressly disclaims any obligation to update or revise any of these forward-looking statements, whether because of future events, new information, a change in its views or expectations, to conform them to actual results or otherwise. CCEC does not assume any responsibility for the accuracy and completeness of the forward-looking statements. You are cautioned not to place undue reliance on forward-looking statements.
Contact Details:
Investor Relations / Media
Brian Gallagher
EVP Investor Relations
Tel. +44 (770) 368 4996
E-mail: b.gallagher@capitalmaritime.com
Nicolas Bornozis/Markella Kara
Capital Link, Inc. (New York)
Tel. +1-212-661-7566
E-mail: ccec@capitallink.com
The unaudited interim condensed consolidated financial statements, included in this report for the three and six-month periods ended June 30, 2026, have been prepared in conformity with accounting principles generally accepted in the United States of America (US GAAP) for interim financial information, except that they do not include the notes and all the information required by U.S. GAAP for complete financial statements.
Capital Clean Energy Carriers Corp.
Unaudited Condensed Consolidated Statements of Comprehensive Income
(In thousands of United States Dollars, except for number of shares and earnings per share)
| For the three-month periods ended |
For the six-month periods ended |
|||||||
| 2026 |
2025 |
2026 |
2025 |
|||||
| Revenues | 104,896 | 96,716 | 202,905 | 198,753 | ||||
| Expenses: | ||||||||
| Voyage expenses | 2,242 | 1,949 | 8,399 | 3,017 | ||||
| Vessel operating expenses | 17,953 | 13,450 | 37,519 | 27,451 | ||||
| Vessel operating expenses - related parties | 2,838 | 2,257 | 5,325 | 4,537 | ||||
| General and administrative expenses | 4,216 | 3,915 | 7,681 | 8,044 | ||||
| Vessel depreciation and amortization | 24,536 | 21,766 | 47,193 | 43,535 | ||||
| Operating income, net | 53,111 | 53,379 | 96,788 | 112,169 | ||||
| Other (expense) / income, net: | ||||||||
| Interest expense and finance cost | (25,345 | ) | (25,952 | ) | (48,379 | ) | (53,721 | ) |
| Other income / (expense), net | 1,270 | 2,263 | (1,104 | ) | 3,911 | |||
| Total other expense, net | (24,075 | ) | (23,689 | ) | (49,483 | ) | (49,810 | ) |
| Net income from continuing operations | 29,036 | 29,690 | 47,305 | 62,359 | ||||
| Net (loss) / income from discontinued operations | (205 | ) | 74 | 3,560 | 48,122 | |||
| Net income from operations | 28,831 | 29,764 | 50,865 | 110,481 | ||||
| Net income from continuing operations per: | ||||||||
| • Common share, basic | 0.48 | 0.51 | 0.79 | 1.06 | ||||
| • Common share, diluted | 0.48 | 0.51 | 0.78 | 1.06 | ||||
| Weighted-average shares outstanding: | ||||||||
| • Common shares, basic | 60,216,529 | 58,718,689 | 60,101,322 | 58,718,005 | ||||
| • Common shares, diluted | 60,414,283 | 58,718,689 | 60,268,704 | 58,718,005 | ||||
| Net income from discontinued operations per: | ||||||||
| • Common share, basic and diluted | - | - | 0.06 | 0.82 | ||||
| Weighted-average shares outstanding: | ||||||||
| • Common shares, basic | 60,216,529 | 58,718,689 | 60,101,322 | 58,718,005 | ||||
| • Common shares, diluted | 60,414,283 | 58,718,689 | 60,268,704 | 58,718,005 | ||||
| Net income from operations per: | ||||||||
| • Common share, basic | 0.48 | 0.51 | 0.85 | 1.88 | ||||
| • Common share, diluted | 0.48 | 0.51 | 0.84 | 1.88 | ||||
| Weighted-average shares outstanding: | ||||||||
| • Common shares, basic | 60,216,529 | 58,718,689 | 60,101,322 | 58,718,005 | ||||
| • Common shares, diluted | 60,414,283 | 58,718,689 | 60,268,704 | 58,718,005 | ||||
Unaudited Condensed Consolidated Balance Sheets
(In thousands of United States Dollars)
| As of |
As of |
|
| Assets | ||
| Current assets | ||
| Cash and cash equivalents | 252,708 | 273,843 |
| Restricted cash | - | 7,024 |
| Trade accounts receivable | 12,258 | 8,437 |
| Prepayments and other assets | 9,620 | 7,437 |
| Inventories | 6,173 | 3,982 |
| Claims | 929 | 1,044 |
| Current assets of discontinued operations | 1,119 | 124,238 |
| Total current assets | 282,807 | 426,005 |
| Fixed assets | ||
| Advances for vessels under construction - related party | - | 54,000 |
| Vessels, net and vessels under construction | 4,284,719 | 3,516,778 |
| Total fixed assets | 4,284,719 | 3,570,778 |
| Other non-current assets | ||
| Above market acquired charters | 49,366 | 66,597 |
| Deferred charges, net | 6,047 | 3,483 |
| Restricted cash | 16,193 | 14,023 |
| Derivative asset | 11,467 | 13,682 |
| Prepayments and other assets | 4,499 | 546 |
| Total non-current assets | 4,372,291 | 3,669,109 |
| Total assets | 4,655,098 | 4,095,114 |
| Liabilities and Shareholders’ Equity | ||
| Current liabilities | ||
| Current portion of long-term debt, net | 133,284 | 122,144 |
| Trade accounts payable | 12,367 | 11,129 |
| Due to related parties | 3,529 | 5,607 |
| Accrued liabilities | 61,835 | 37,717 |
| Deferred revenue | 21,368 | 29,413 |
| Current liabilities of discontinued operations | 12,694 | 103,514 |
| Total current liabilities | 245,077 | 309,524 |
| Long-term liabilities | ||
| Long-term debt, net | 2,797,548 | 2,232,193 |
| Below market acquired charters | 56,652 | 53,531 |
| Deferred revenue | - | 499 |
| Derivative liabilities | 8,580 | - |
| Total long-term liabilities | 2,862,780 | 2,286,223 |
| Total liabilities | 3,107,857 | 2,595,747 |
| Total shareholders’ equity | 1,547,241 | 1,499,367 |
| Total liabilities and shareholders’ equity | 4,655,098 | 4,095,114 |
Unaudited Condensed Consolidated Statements of Changes in Shareholders’ Equity
(In thousands of United States Dollars except number of shares)
| No. of shares | Share Capital |
Additional Paid- In Capital |
Retained Earnings |
Accumulated Other Comprehensive (Loss) / Income |
Total | ||||||
| Balance at |
60,708,914 | 607 | 1,263,065 | 237,270 | (1,575 | ) | 1,499,367 | ||||
| Dividends declared (distributions of |
- | - | - | (17,940 | ) | - | (17,940 | ) | |||
| Net income from operations | - | - | - | 50,865 | - | 50,865 | |||||
| Equity compensation expense | - | - | 3,171 | (263 | ) | - | 2,908 | ||||
| Dividends reinvestment plan, net of expenses | 551,336 | 6 | 11,470 | - | - | 11,476 | |||||
| Repurchase and retirement of common shares | (99,411 | ) | - | (2,145 | ) | - | - | (2,145 | ) | ||
| Other comprehensive income | - | - | - | - | 2,710 | 2,710 | |||||
| Balance at |
61,160,839 | 613 | 1,275,561 | 269,932 | 1,135 | 1,547,241 | |||||
| No. of shares | Share Capital | Retained Earnings | Accumulated Other Comprehensive Loss | Total | |||||
| Balance at |
59,938,374 | 599 | 1,240,044 | 102,615 | (289 | ) | 1,342,969 | ||
| Dividends declared (distributions of |
- | - | - | (17,803 | ) | - | (17,803 | ) | |
| Net income from operations | - | - | - | 110,481 | - | 110,481 | |||
| Equity compensation expense | - | - | 3,171 | (315 | ) | - | 2,856 | ||
| Proceeds from offering, net | 7,954 | - | 173 | - | - | 173 | |||
| Other comprehensive income | - | - | - | - | 177 | 177 | |||
| Balance at |
59,946,328 | 599 | 1,243,388 | 194,978 | (112 | ) | 1,438,853 | ||
Unaudited Condensed Consolidated Statements of Cash Flows
(In thousands of United States Dollars)
| For the six-month periods ended |
||||
| 2026 |
2025 |
|||
| Cash flows from operating activities of continuing operations: | ||||
| Net income from operations | 50,865 | 110,481 | ||
| Less: Net income from discontinued operations | 3,560 | 48,122 | ||
| Net income from continuing operations | 47,305 | 62,359 | ||
| Adjustments to reconcile net income to net cash provided by operating activities: | ||||
| Vessel depreciation and amortization | 47,193 | 43,535 | ||
| Amortization and write-off of deferred financing costs | 2,691 | 1,837 | ||
| Amortization / accretion of above / below market acquired charters | 11,118 | 11,130 | ||
| Amortization of ineffective portion of derivatives | (103 | ) | (103 | ) |
| Equity compensation expense | 3,171 | 3,171 | ||
| Change in fair value of derivatives | 13,608 | (20,534 | ) | |
| Unrealized bonds exchange differences | (13,505 | ) | 19,488 | |
| Changes in operating assets and liabilities: | ||||
| Trade accounts receivable | (3,821 | ) | (3,490 | ) |
| Prepayments and other assets | (6,136 | ) | (760 | ) |
| Due from related party | - | 1,131 | ||
| Inventories | (2,191 | ) | 286 | |
| Trade accounts payable | 603 | (5,247 | ) | |
| Due to related parties | (2,078 | ) | 1,996 | |
| Accrued liabilities | 24,018 | 4,646 | ||
| Deferred revenue | (8,544 | ) | (9,275 | ) |
| Dry Docking - paid | (3,661 | ) | - | |
| Net cash provided by operating activities of continuing operations | 109,668 | 110,170 | ||
| Cash flows from investing activities of continuing operations: | ||||
| Vessel acquisitions, vessels under construction and improvements including time and bareboat charter agreements | (751,521 | ) | (130,533 | ) |
| Expenses paid for the sale of vessel | - | (220 | ) | |
| Proceeds from insurance claims | 115 | - | ||
| Net cash used in investing activities of continuing operations | (751,406 | ) | (130,753 | ) |
| Cash flows from financing activities of continuing operations: | ||||
| Proceeds from long-term debt | 837,125 | - | ||
| Deferred financing costs paid | (10,249 | ) | (269 | ) |
| Payments of long-term debt | (238,367 | ) | (60,342 | ) |
| Rights offering costs paid | (68 | ) | (167 | ) |
| Dividends paid | (6,406 | ) | (17,803 | ) |
| Proceeds from offering, net of commissions paid | - | 173 | ||
| Repurchase of common shares | (2,145 | ) | - | |
| Net cash provided by / (used in) financing activities of continuing operations | 579,890 | (78,408 | ) | |
| Net decrease in cash, cash equivalents and restricted cash from continuing operations | (61,848 | ) | (98,991 | ) |
| Cash flows from discontinued operations | ||||
| Operating activities | 579 | 6,419 | ||
| Investing activities | 119,655 | 119,803 | ||
| Financing activities | (84,375 | ) | (5,785 | ) |
| Net increase in cash, cash equivalents and restricted cash from discontinued operations | 35,859 | 120,437 | ||
| Net (decrease)/ increase in cash, cash equivalents and restricted cash | (25,989 | ) | 21,446 | |
| Cash, cash equivalents and restricted cash at the beginning of the period | 294,890 | 335,175 | ||
| Cash, cash equivalents and restricted cash at the end of the period | 268,901 | 356,621 | ||
| Supplemental cash flow information | ||||
| Cash paid for interest net of interest capitalized during the construction period | 38,556 | 56,210 | ||
| Non-Cash Investing and Financing Activities | ||||
| Capital expenditures included in liabilities | 2,924 | 3,797 | ||
| Capitalized dry-docking costs included in liabilities | 3,409 | 3,129 | ||
| Deferred financing and offering costs included in liabilities | 1,146 | 324 | ||
| Expenses for sale of vessels included in liabilities | 3,872 | 7,602 | ||
| Dividends reinvestment plan issuance of new shares | 11,534 | - | ||
| Reconciliation of cash, cash equivalents and restricted cash | ||||
| Cash and cash equivalents | 252,708 | 335,074 | ||
| Restricted cash - non-current assets | 16,193 | 21,547 | ||
| Total cash, cash equivalents and restricted cash shown in the statements of cash flows | 268,901 | 356,621 | ||
Appendix A
I. Discontinued Operations - Vessels
| Type | TEU | Memorandum of Agreement Date |
Delivery | |
| M/V Akadimos | Neo Panamax Container Vessel | 9,288 | ||
| M/V Long Beach Express | Panamax Container Vessel | 5,089 | ||
| M/V Seattle Express | Panamax Container Vessel | 5,089 | ||
| M/V Fos Express | Panamax Container Vessel | 5,089 | ||
| M/V Athenian | Neo Panamax Container Vessel | 9,954 | ||
| M/V Athos | Neo Panamax Container Vessel | 9,954 | ||
| M/V Aristomenis | Neo Panamax Container Vessel | 9,954 | ||
| M/V Hyundai Premium | Neo Panamax Container Vessel | 5,023 | ||
| M/V Hyundai Paramount | Neo Panamax Container Vessel | 5,023 | ||
| M/V Hyundai Prestige | Neo Panamax Container Vessel | 5,023 | ||
| M/V Hyundai Privilege | Neo Panamax Container Vessel | 5,023 | ||
| M/V Hyundai Platinum | Neo Panamax Container Vessel | 5,023 | ||
| M/V Manzanillo Express | Neo Panamax Container Vessel | 13,312 | ||
| M/V Buenaventura Express | Neo Panamax Container Vessel | 13,696 |
II. Discontinued Operations - Unaudited Condensed Consolidated Statements of Comprehensive Income
(In thousands of United States Dollars)
| For the three-month periods ended |
For the six-month periods ended |
|||||||
| 2026 |
2025 |
2026 |
2025 |
|||||
| Revenues | - | 7,443 | 719 | 17,269 | ||||
| Expenses / (income), net: | ||||||||
| Voyage expenses | - | 178 | 18 | 388 | ||||
| Vessel operating expenses | 210 | 1,575 | 234 | 3,947 | ||||
| Vessel operating expenses - related party | - | 210 | 13 | 507 | ||||
| Vessel depreciation and amortization | - | 2,425 | - | 4,851 | ||||
| Gain on sale of vessels | - | - | (4,171 | ) | (46,213 | ) | ||
| Operating (loss)/income, net | (210 | ) | 3,055 | 4,625 | 53,789 | |||
| Other (expense) / income, net: | ||||||||
| Interest expense and finance cost | (1 | ) | (2,927 | ) | (1,075 | ) | (5,882 | ) |
| Other income / (expense), net | 6 | (54 | ) | 10 | 215 | |||
| Total other income / (expense), net | 5 | (2,981 | ) | (1,065 | ) | (5,667 | ) | |
| Net (loss) / income from discontinued operations | (205 | ) | 74 | 3,560 | 48,122 | |||
During the six-month period ended
III. Discontinued Operations - Unaudited Condensed Selected Balance Sheets Information
(In thousands of United States Dollars)
| As of |
As of |
|
| Cash and cash equivalents | 56 | 680 |
| Trade accounts receivable | 319 | 92 |
| Prepayments and other assets | 695 | 1,205 |
| Claims | 49 | 49 |
| Assets held for sale | - | 122,212 |
| Current assets of discontinued operations | 1,119 | 124,238 |
| Trade accounts payable | 3,962 | 2,446 |
| Accrued liabilities | 8,732 | 9,017 |
| Liabilities associated with vessel held for sale | - | 92,051 |
| Current liabilities of discontinued operations | 12,694 | 103,514 |
On
Appendix B
Transactions with Related Parties:
The Company and its subsidiaries have related party transactions with
For information relating to our related parties please refer to Note 5 of our audited Consolidated Financial Statements included in our Annual Report filed with the
Balances and transactions with related parties consisted of the following:
| Consolidated Balance Sheets |
As of |
As of |
|||
| Liabilities: | |||||
| CSM - payments on behalf of the |
$ | 25 | $ | 35 | |
| CMTC - payments on behalf of the |
800 | - | |||
| Capital-Container – payments on behalf of the |
178 | 1,877 | |||
| Capital-Gas Management- payments on behalf of the |
2,526 | 3,695 | |||
| Due to related parties | $ | 3,529 | $ | 5,607 |
| For the three-month periods ended |
For the six-month periods ended |
||||||||
| Consolidated Statements of Comprehensive Income | 2026 | 2025 | 2026 | 2025 | |||||
| Vessel operating expenses | $ | 2,838 | $ | 2,257 | $ | 5,325 | $ | 4,537 | |
| General and administrative expenses (c) | 926 | 922 | 1,836 | 1,843 | |||||
(a) Managers - Payments on behalf of the Company: This line item represents the amount outstanding for payments for operating and voyage expenses made by the Managers on behalf of the Company and its subsidiaries.
(b) Amounts relating to vessels’ acquisitions: This line item mainly includes bunkers and lubricants onboard payable to CMTC in connection with the acquisition of the LNG/Cs Agamemnon and Archimidis.
(c) General and administrative expenses: This line item mainly includes fees relating to internal audit, investor relations and consultancy fees.


Source: Capital Clean Energy Carriers Corp.